In today’s SE16 housing market, property market data isn’t just helpful – it’s essential. For SE16 homeowners and landlords looking to buy or sell a home, understanding the latest SE16 property trends, buyer behaviour, or house pricing movements is the difference between making a confident move and flying blind.
Data reveals where the market has been, where it’s heading, and how to position a home for success. It cuts through the noise, replaces guesswork with insight, and empowers better decisions. When used well, property data also becomes a seller’s compass and, subsequently, as a buyer, the edge as well – guiding your strategy, pricing, and timing in a property market that’s constantly shifting. In short, those who understand the data of the SE16 property market (and the UK as a whole) move smarter. And those who ignore it risk being left behind.
The property market in SE16 has seen a notable transformation in recent years.
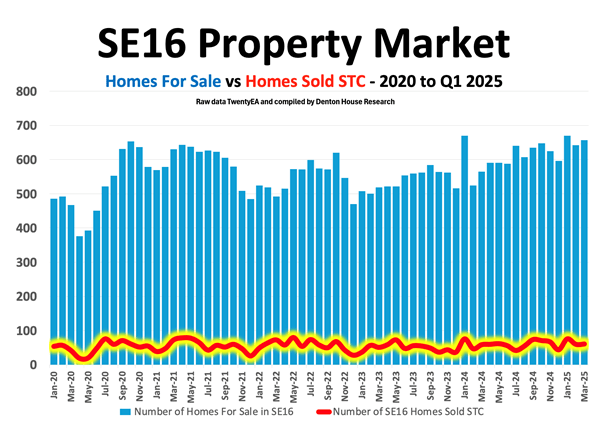
Each week in my blog posts, I use data to share my thoughts about the SE16 property market. This week I am going to look at the number of SE16 homes for sale on a month-by-month basis and then compare that with the volume of sales agreed (sold subject to contract—SSTC) on a month-by-month basis between January 2020 and March 2025.
From that information, I can show the direction of the local property market by calculating the percentage of SE16 homes each month that have been selling.
Since January 2020, an average of 9.7% of SE16 homes on the market have sold STC each month
For some comparison, the lowest month since 2020, as expected, was the first month of lockdown, April 2020, when it was 5.1%. The highest month was March 2022, when it was 14.8%. In March 2025, that figure was 9.3%.
A closer look at this data reveals how the market has shifted and underlines the importance of sensible pricing—particularly now that the supply of homes has increased since Easter 2022.
- In 2020, SE16 had an average of 520 homes for sale, with 51 selling STC each month. That means 9.9% of SE16 homes on the market found a buyer each month.
- In 2021, SE16 had an average of 593 homes for sale, with 56 selling STC each month. That means 9.4% of SE16 homes on the market found a buyer each month.
- In 2022, SE16 had an average of 548 homes for sale, with 59 selling STC each month. That means 10.7% of SE16 homes on the market found a buyer each month.
- In 2023, SE16 had an average of 539 homes for sale, with 50 selling STC each month. That means 9.3% of SE16 homes on the market found a buyer each month.
- In 2024, SE16 had an average of 607 homes for sale, with 61 selling STC each month. That means 10.0% of SE16 homes on the market found a buyer each month.
- In Q1 2025, SE16 had an average of 656 homes for sale, with 66 selling STC each month. That means 10.0% of SE16 homes on the market found a buyer each month.
The Evolution of the SE16 Market (2020–2025)
Between January 2020 and February 2020, the SE16 property market experienced relative stability. Things changed dramatically with the arrival of COVID-19 in March 2020. The uncertainty led to a sharp drop in home sales during April and May of that year, as many buyers hesitated amid the economic upheaval.
However, following the lifting of the property market lockdown in May/June 2020, activity rebounded. The number of homes coming onto the market increased, as did the number of SE16 homes selling.
This period was marked by strong demand despite reduced stock levels. The rush was fuelled by demand and the government’s stamp duty holiday, encouraging people to move.
As 2022 began, the market began returning to a more typical state. As the year went on the number of homes coming onto the market increased, yet the number of SE16 homes selling started to stabilise. This meant the number of homes for sale in SE16 started to increase in 2022.
Then came two significant setbacks between late 2022 and early 2023.
Budget Fallout and Rising Interest Rates
The first blow came in autumn 2022 with the Truss government’s mini-budget, severely impacting buyer confidence. Over the months that followed, SE16’s average monthly sales fell. A recovery was underway by spring 2023, with sales rising. But this was short-lived—as interest rates climbed during summer 2023, buyer activity dipped once again, and sales fell.
The number of homes for sale continued to rise in 2024
In the early part of 2024, monthly house sales in SE16 were quite healthy, yet the number of homes for sale was increasing. This jump in supply was due to several factors: sellers trying to cash in on still elevated house prices, a spike in new build activity, landlords selling up because section 24 taxation rules were beginning to bite, or simply more homes returning to the market after failing to sell previously.
SE16 in Context: Comparing Proportions to the UK
A second graph, with a dark background, offers further insights by looking at the percentage of homes sold each month as a share of the total available stock.
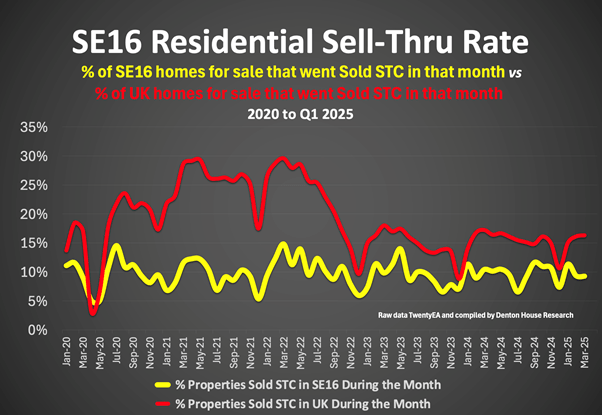
The yellow line tracks SE16’s performance, while the red line shows the UK-wide equivalent.
From Easter 2020 through to early 2022, there were times when SE16 saw an increase in the percentage of available homes going under offer, often hitting the mid-teens. As you can see, the proportion of homes selling in SE16 remained steadier than the proportion of homes throughout the UK.
However, since 2022, that picture has changed. The proportion of homes selling compared to those available has declined slightly in SE16, now below 10%.
What Does This Mean for SE16 People Looking to Move?
While buyer demand remains steady, the rise in available properties means there is a greater supply of homes to buy. SE16 buyers have more choice.
For SE16 homeowners looking to sell, this means competition is more intense than in previous years. Although buyers are still active, the sheer volume of homes on the market means sellers must be more strategic. A realistic asking price is now more important than ever.
An overpriced home risks being overlooked and left on the market. A well-priced property, on the other hand, stands a better chance of attracting attention and swiftly securing a buyer.
There’s also a practical reason to price sensibly. According to research by Denton House using TwentyEA data, if a property sells within 25 days of coming to market, there’s a 94% chance it will go on to complete. However, if it takes more than 100 days to agree on a sale, that figure drops to 56%, with a 44% chance of it falling through.
SE16’s housing market remains active, but sellers face a new reality: the number of available homes has increased since mid-2022. To achieve a successful move, they must be attuned to the market and price their homes realistically.
Understanding local supply and demand – and adjusting expectations accordingly – is now critical. With more choices available to buyers, strategic pricing will separate the homes that sell from those that don’t.
If you want more data on the SE16 property market, follow me on social media for weekly updates on our local property market. If you would like an informal, no-cost, and no-obligation chat about the SE16 property market, whether you are a buyer or seller, feel free to drop me a line, send a message on social media or reach out to me by telephone.

